


Six Steps to Reduce Costs of your Kubernetes Workload
How my team managed to cut infrastructure costs of our Kubernetes workloads by more than € 100K per year


Kubernetes is a wonderful open-source platform. Originating from Google’s internal Borg system it became the de-facto standard to orchestrate and run nearly any containerized workload. However, there are voices in the IT industry that consider the costs of running on Kubernetes as too expensive. At the same time, I noticed that many Kubernetes workloads aren't configured cost-effectively. Here are six battle-proven steps to reduce the costs of running your workload in Kubernetes. Applying these steps to our workloads enabled my team to save over € 100K of infrastructure costs per year.
📋 The Preparation Phase
Before we can save costs, there are three prerequisites that I will elaborate on in the following section.
Track Resource Usage
Most likely you will already have some metrics for your resource usage. Building an entire observability platform is out of scope for this blog post, but I would like to highlight a few points to make sure we start from the same baseline. The kubelet exposes all of its runtime metrics on a /metrics endpoint in the Prometheus format. Typically metrics are collected by observability agents like the prometheus-agent. For cost reduction, you will want to focus on the Memory and CPU usage of a container and visualize usage over time. I used the following query to visualize per-container utilization over time in a Grafana dashboard:
sum(node_namespace_pod_container:container_cpu_usage_seconds_total:sum_irate) by (container)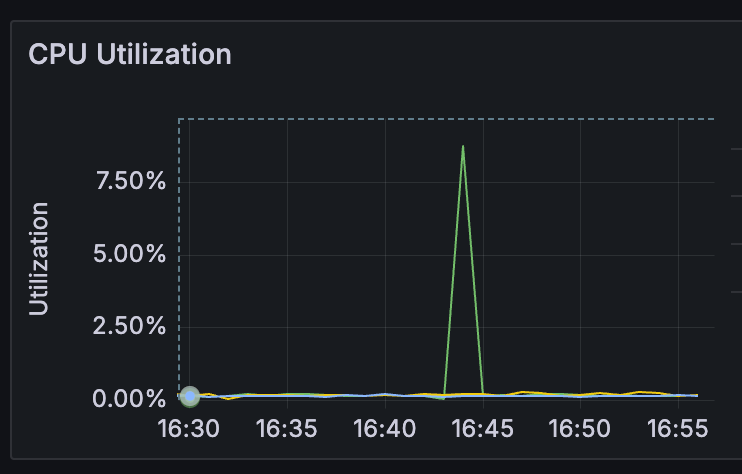
sum(container_memory_working_set_bytes) by (container)
Define Resource Constraints
Once you have visibility into resource utilization you can assign per-container constraints with the limit and request parameter. Straight from the Kubernetes documentation:
If the node where a Pod is running has enough of a resource available, it's possible (and allowed) for a container to use more resource than its
requestfor that resource specifies. However, a container is not allowed to use more than its resourcelimit.
So the request parameter defines the resources that are reserved for the container, while the limit defines the maximal resource utilization the container is allowed to burst up to. The following example from the same Kubernetes documentation shows a YAML configuration for a container that comes with 64MiB of memory and one 250 millicpu assigned, allowing to double each in case of usage bursts.
---
apiVersion: v1
kind: Pod
metadata:
  name: frontend
spec:
  containers:
  - name: app
    image: images.my-company.example/app:v4
    resources:
      requests:
        memory: "64Mi"
        cpu: "250m"
      limits:
        memory: "128Mi"
        cpu: "500m"
Resource configuration directly impacts the Kubernetes quality of service class your pod is associated with and can either be Guaranteed, Burstable, or BestEffort.
Defining per-container resource limits is a prerequisite for effectively tracking the infrastructure costs of your Kubernetes workload. Furthermore, resource limits mitigate noisy neighbor issues and enable you to set up alerts if container resource utilization reaches critical thresholds like 90% of the defined memory limit.
Track Costs per Workload
Infrastructure costs are typically paid for on the node level. For example, AWS EKS billing is based on the number of EC2 nodes assigned to the Kubernetes cluster. How do we break down the per-node costs into workload-specific costs?
This problem is addressed by another observability agent that fetches the costs of a node in real time considering factors like cloud provider and geographical region. The agent then breaks down per node- into actual per-container costs. In this article, I will use the CPU and memory cost metrics collected by the open cost agent. Note that the agent supports further metrics like network egress costs.
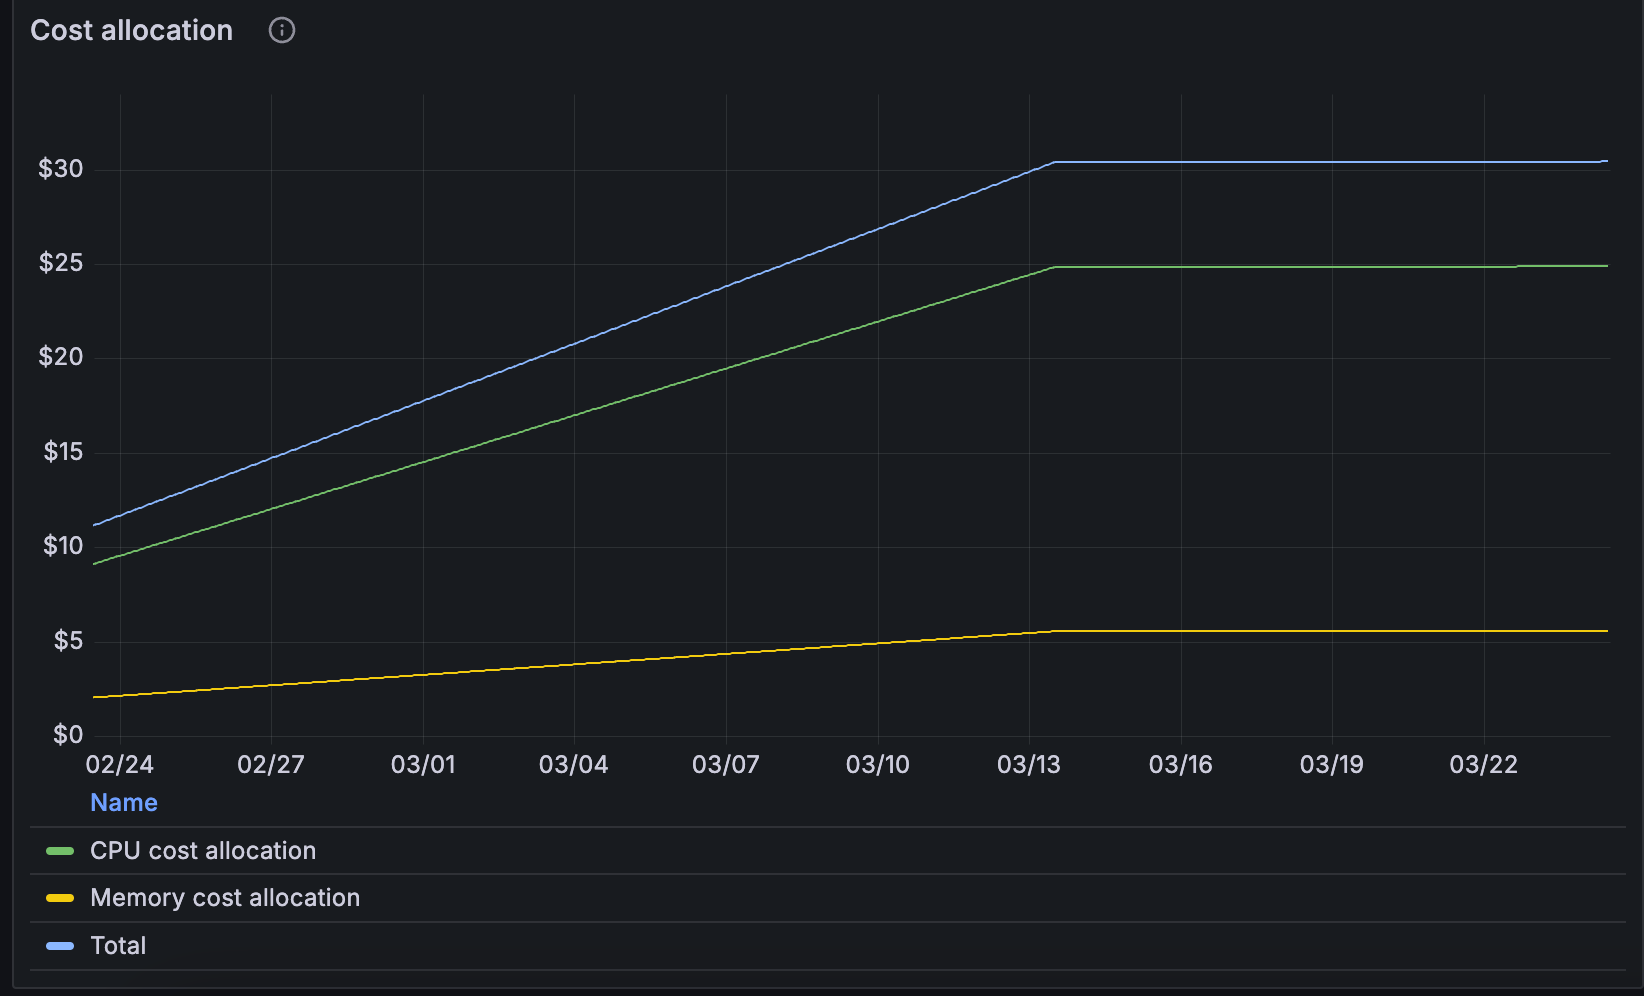
I will use the pre-configured dashboards in Grafana to drill down costs per cluster, namespace, and container. The following panels show the costs of resources allocated to the container by the request parameter we have configured in the previous step.

Costs are considered idle if resources have been allocated for you container, but remain unused.

While not straightforward, it is possible to visualize cost evolution over time. The following query can be used as an example to display rolling CPU costs over time:
sum_over_time(sum(
        # actual cost of cpu allocation and usage is the max of:
        max by (cluster, namespace, node) (
            # cpu requests (in cores)
            sum by (cluster, namespace, node, resource) (kube_pod_container_resource_requests{cluster=~"your-cluster-name", namespace="your-workload-namespace", resource="cpu"})
            OR
            # cpu usage (in cores)
            sum by (cluster, namespace, node) (max by (cluster, namespace, node, pod, container) (
              rate(container_cpu_usage_seconds_total{cluster=~"your-cluster-name", namespace="your-workload-namespace"}[4m0s])
              OR
              label_replace(
                rate(container_cpu_usage_seconds_total{cluster=~"your-cluster-name", namespace="your-workload-namespace"}[4m0s])
                , "node", "$1", "instance", "([^:]+).*"
              )
            ))
        )
        # multiplied by the hourly cost per node where this pod is running
        * on (cluster, node) group_left
        max by (cluster, node) (node_cpu_hourly_cost{cluster=~"your-cluster-name"})
      )[$__range:1h])
💰The Cost Reduction Phase
By applying resource constraints as well as tracking resource usage and cost we have everything in place to start saving money.
Reduce Idle Costs
Idle resources cost money but remain unused. Remarkable cost reductions are possible when you double down on reducing idle resources.
fine-tune per container resource constraints: While it's better to start with slightly too high resource constraints you will want to reduce the
requestandlimitparameters as much as possible over time. Fine-tune these parameters carefully in multiple iterations to avoid unwanted side effects. Keep an eye on the saturation of your application. When resource thresholds are set too low most applications do now fail immediately, but instead start to slow down and latencies increase. Often it's possible to refactor the application in a way so that less memory and CPU are required which will open up further cost savings.horizontal pod autoscaling: Kubernetes makes it easy to configure horizontal pod autoscaling (HPA) for your workload. While it might sound obvious to reap the benefit of HPA I have seen too many configurations with a fixed set of replicas. A statically configured workload will have a fixed replica count configured for peak customer load, and miss out on idle cost savings during lower times of traffic. For spiky customer traffic HPA can bring you cost savings of 50% and more. The following configuration is an example of such a horizontal pod autoscaler for a deployment called your-workload-name and scales based on average CPU utilization in a range of three to ten replicas.
apiVersion: autoscaling/v2
kind: HorizontalPodAutoscaler
metadata:
  name: workload-horizontal-pod-autoscaler
  namespace: "your-workload-namespace"
spec:
  scaleTargetRef:
    apiVersion: apps/v1
    kind: Deployment
    name: "your-workload-name"
  maxReplicas: 10
  minReplicas: 3
  metrics:
  - type: Resource
    resource:
      name: cpu
      target:
          type: Utilization
          averageUtilization: 70
Sharing of Resources
Depending on your domain and workload you may want to share more infrastructure resources between customers, also referred to as a multi-tenant system. Sharing more resources opens up an entirely new dimension of cost reductions and is part of the magic sauce that makes SaaS companies so attractive and cost-efficient. At the same time, you will have to consider the compliance and security implications in doing so. For example, you might have a Kubernetes namespace for each customer to provide a strong level of isolation, but at the same time increase idle costs. Alternatively, you can consider creating namespaces per workload to reduce idle costs - but also weaken customer isolation. I will keep it short here since I'm considering writing a separate article on this topic.
Materialise Cost Savings
After fine-tuning resource constraints and enabling HPA your cost dashboards will nicely show the cost reductions of your workload. However, it’s important to note that cost savings will only materialize into real-world cost reductions on your bill if your changes have an impact on the Kubernetes node and cluster level. Kubernetes cluster setups that scale nodes horizontally like AWS Fargate for EKS or Karpenter are your friend and reduce node count automatically. Also, consider if switching to smaller node types makes sense, and don’t forget to re-evaluate your reserved instance setup.
TL;DR
So here you go. Six battle-proven steps to reduce the costs of running your workload in Kubernetes:
Track Resource Usage: Use tools like Prometheus and Grafana to understand the resource consumption of your workload.
Define Resource Constraints: Configure thresholds for resource consumption. Start with slightly too high thresholds to avoid saturation of your workload.
Track Costs per Workload: Use a cost agent to track and visualize the costs of your workload.
Reduce Idle Costs: Fine-tune resource thresholds and use HPA to reduce idle costs for your workload.
Sharing of Resources: Consider sharing Kubernetes resources between customers for a multi-tenant system.
Materialise Cost Savings: Make sure that the reduced idle costs are reflected in the setup of your Kubernetes cluster by adjusting node count and type.
Over to you: What kind of tools do you use to track and reduce costs in Kubernetes?